Go to the Website Desmos. Then, Click on the ‘Math Tools’ Dropdown: Linear and Non-linear Relations Assignment, SWSC, Australia
| Subject | Linear and Non-linear Relations |
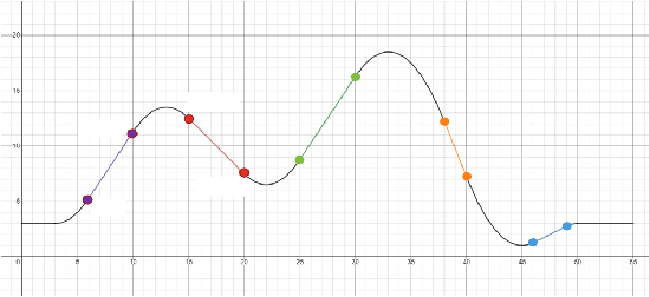
Part One: Analyse A Rollercoaster Design
Note: The rollercoaster is on the next page.
- In which sections of the track is the slope positive? Explain how you know.
- In which sections of the track is the slope negative? Explain how you know.
- Which sections of the graph have the same gradient? (Identity by observing the graph, you don’t need to make any calculations).
- Calculate the gradient for the purple section of the track.
- Calculate the gradient for the red section of the track.
- What is the y-intercept of the graph? What does this value represent?
- How long is the track horizontally?
- How tall is the highest point on the track from the ground?
- Which part of the track do you think would be the scariest? Explain why.
Part Two: Sketch A Rollercoaster Design
Q1. Complete the following table of values (show working)
Section 1: = 3 + 1
0
1
2
3
Section 2: = −2 + 18
5
6
7
8
Section 3: = 1
10
11
12
13
Q2. Plot the graphs on the grid paper provided using the co-ordinates from the table of values completed above. Connect the sections of the graph with curved lines.
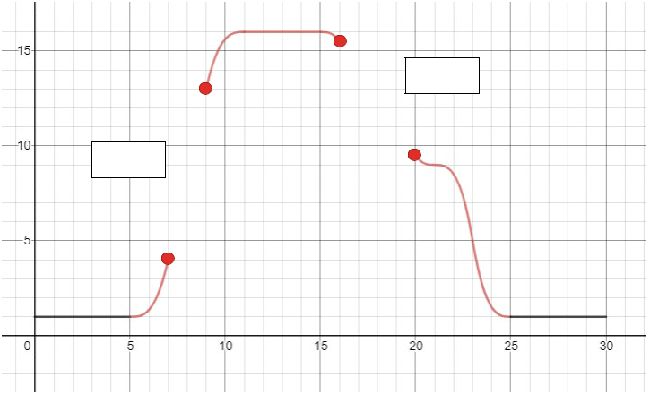
Part Three: Finish An Incomplete Design
- Identify the coordinates of the beginning and endpoints of Section 1.
- Calculate the gradient of the rollercoaster in Section 1.
- By choosing one of the co-ordinates and using the calculated gradient, find the ‘y-intercept’ value of the equation for Section 1.
- Hence, state the equation used to represent Section 1.
- Identify the coordinates of the beginning and endpoints of Section 2.
- Calculate the gradient of the rollercoaster in Section 2.
- By choosing one of the co-ordinates and using the calculated gradient, find the ‘y-intercept’ value of the equation for Section 2.
- Hence, state the equation used to represent Section 2.
- Draw the equations on the graph provided to complete the rollercoaster design.
Part Four: Create Your Own Design
Go to the website Desmos (LINK: https://www.desmos.com/). Then, click on the ‘Math Tools’ dropdown and select ‘Graphing Calculator’. This is where you will be able to create your own rollercoaster design.
The rollercoaster design must follow the following guidelines:
- It has at least one section with a positive gradient.
- It has at least one section with a negative gradient.
- It never goes above 20 meters tall.
- It never hits the ground (0 meters).
- It is between 20 metres and 80 metres in horizontal length.
- The slope/gradient is never greater than 5.5 or less than -5.5.
- The track must start and finish horizontally and be at the same height at the beginning and end.
Here are some hints to help you with your design:
- The y-axis represents how far from the ground a particular point is.
- The x-axis represents the horizontal distance of the track.
- Start off each equation by writing ‘y = ‘.
- Use the curly brackets { } to show where you want a section of the graph to start and stop. For example, {0 ≤ 𝑥𝑥 ≤ 5} will draw the graph from 0 to 5 along the x-axis.
- You are NOT expected to find the equations for any curved sections of the track. Instead, focus on creating the straight sections of the track and connect them with curved lines.
Once you have finished your design, you need to write about your design. Make sure to talk about the following:
- Context: How long is your design? How tall is the tallest point of your design? What is the general shape of your design? Why do we need curved sections to connect the lines rather than having straight lines connecting directly?
- Gradients: Where are there positive and negative gradients? What are the values of the gradients in these sections? Which gradients are steeper or less steep?
- Y-intercepts: What is the y-intercept for your graph? What does it represent? What do the y-intercepts in your other equations represent?
- Equations: What were the equations which represented the different sections of your graph? Why did you use those equations in your design?
- Calculations: Give a worked example of how you could have calculated the gradient of one of your lines by hand using two coordinate points. Also, give an example of how you could have found the equation for one of your lines by hand using two coordinate points.
Get Help By Expert
At AustraliaAssignmentHelp.online, you will get professional academic writing assistance with any level of tough statistics assignments. You have to pay a very little amount for the great statistics assignment help services that will help you to boost your grades. You will get unlimited revision for Linear and Non-linear Relations assignments or every assignment that you will order.
Recent Solved Questions
- BSBDAT501: Select Methods Of Data Analysis Relevant To Each Dataset: Analyze Data Report, UniSA, Australia
- GENG1101: you are required to produce technical engineering drawings in Solidworks Drawings are based on supplied Solidworks part files: Engineering Drawings Assignment, University of Western Australia
- AMSM700: Demonstrate The Linkage between the Organization’s Strategy and Its Vision: Strategic Management Assignment, ARA, New Zealand
- We Are Pleased To Provide A Report On Our Investigations Undertaken: Initial Planning Case Study, UQ, Australia
- The Brain Is An Organ Weighing Around 3 Pounds/1.3 Kilograms: Physiology Of The Brain Assignment, MU, Australia
- BSBESB301: Identify your business idea or opportunity as your case study OR select a case study, as discussed with your trainer: Investigate business opportunities Coursework, Australia
- NURS3003: Discuss your understanding of the link between chronic health conditions, complex needs: Dynamics of Practice 3 – Hospital avoidance Case Study, Flinders University, Australia
- AYB230: Activist CEO’s are Acting Outside the Scope of Their Fiduciary Duties: Corporations Law Assignment, QUT, Australia
- ANSTO Scientists Analyze the Composition of Gases Trapped Inside Deep Antarctic Ice: Physics Assignment, BHS, Australia
- COML2020: A Client Has Come To You To Ask About Listing Her Public Company: Companies And Partnership Law, USA, Australia